import pandas as pd
import numpy as np
import matplotlib.pyplot as plt
import akshare as ak
from datetime import datetime

def get_stock_data(stock_code, start_date, end_date):
    """
    使用akshare获取股票历史数据

    参数:
    stock_code: 股票代码,例如 'SH600519'(贵州茅台)或 'sz000001'(平安银行)
    start_date: 开始日期,格式 'YYYY-MM-DD'
    end_date: 结束日期,格式 'YYYY-MM-DD'

    返回:
    包含股票历史数据的DataFrame
    """
    try:
        # 转换日期格式为akshare要求的格式
        start_date_ak = start_date.replace('-', '')
        end_date_ak = end_date.replace('-', '')

        # 转换股票代码格式为akshare要求的格式
        if stock_code.startswith('SH'):
            stock_code_ak = f'sh{stock_code[2:]}'
        elif stock_code.startswith('SZ'):
            stock_code_ak = f'sz{stock_code[2:]}'
        else:
            # 假设已经是正确格式
            stock_code_ak = stock_code

        # 使用akshare获取股票数据
        stock_df = ak.stock_zh_a_hist(symbol=stock_code_ak[2:], period="daily",
                                     start_date=start_date_ak, end_date=end_date_ak)

        stock_df['日期'] = pd.to_datetime(stock_df['日期'])
        stock_df.set_index('日期', inplace=True)
        return stock_df
    except Exception as e:
        print(f"获取数据失败: {e}")
        return None

def calculate_technical_indicators(df):
    """
    计算常用技术指标

    参数:
    df: 包含股票数据的DataFrame

    返回:
    包含计算后指标的DataFrame
    """
    # 计算均线
    df['MA5'] = df['收盘'].rolling(window=5).mean()  # 5日均线
    df['MA10'] = df['收盘'].rolling(window=10).mean()  # 10日均线
    df['MA20'] = df['收盘'].rolling(window=20).mean()  # 20日均线
    df['MA60'] = df['收盘'].rolling(window=60).mean()  # 60日均线

    # 计算RSI指标
    def calculate_rsi(data, period=14):
        delta = data['收盘'].diff(1)
        gain = delta.where(delta > 0, 0)
        loss = -delta.where(delta < 0, 0)

        avg_gain = gain.rolling(window=period).mean()
        avg_loss = loss.rolling(window=period).mean()

        rs = avg_gain / avg_loss
        rsi = 100 - (100 / (1 + rs))
        return rsi

    df['RSI14'] = calculate_rsi(df, period=14)

    # 计算股价变化标准差(20日窗口)
    df['收盘价标准差'] = df['收盘'].rolling(window=20).std()

    # 计算日收益率
    df['日收益率'] = df['收盘'].pct_change()

    return df

def plot_stock_analysis(df, stock_code):
    """
    绘制股票分析图表

    参数:
    df: 包含股票数据和指标的DataFrame
    stock_code: 股票代码
    """
    # 设置中文显示
    plt.rcParams['font.family'] = ['SimHei', 'Microsoft YaHei']
    plt.rcParams['axes.unicode_minus'] = False

    # 创建一个包含4个子图的画布
    fig, (ax1, ax2, ax3, ax4) = plt.subplots(4, 1, figsize=(14, 16), sharex=True)

    # 1. 绘制股价和均线
    ax1.plot(df.index, df['收盘'], label='收盘价', linewidth=1.5, color='black')
    ax1.plot(df.index, df['MA5'], label='MA5', linewidth=1.2, color='blue')
    ax1.plot(df.index, df['MA10'], label='MA10', linewidth=1.2, color='green')
    ax1.plot(df.index, df['MA20'], label='MA20', linewidth=1.2, color='orange')
    ax1.plot(df.index, df['MA60'], label='MA60', linewidth=1.2, color='red')
    ax1.set_title(f'{stock_code} 股价与均线走势')
    ax1.set_ylabel('价格 (元)')
    ax1.legend()
    ax1.grid(True, linestyle='--', alpha=0.7)

    # 2. 绘制成交量
    ax2.bar(df.index, df['成交量'], label='成交量', color='purple', alpha=0.6)
    ax2.set_title('成交量')
    ax2.set_ylabel('成交量')
    ax2.grid(True, linestyle='--', alpha=0.7)

    # 3. 绘制RSI
    ax3.plot(df.index, df['RSI14'], label='RSI14', linewidth=1.2, color='brown')
    ax3.axhline(y=70, color='red', linestyle='--', alpha=0.7, label='超买线')
    ax3.axhline(y=30, color='green', linestyle='--', alpha=0.7, label='超卖线')
    ax3.set_title('RSI指标')
    ax3.set_ylabel('RSI值')
    ax3.legend()
    ax3.grid(True, linestyle='--', alpha=0.7)

    # 4. 绘制收盘价标准差
    ax4.plot(df.index, df['收盘价标准差'], label='收盘价标准差', linewidth=1.2, color='teal')
    ax4.set_title('股价变化标准差')
    ax4.set_ylabel('标准差')
    ax4.set_xlabel('日期')
    ax4.legend()
    ax4.grid(True, linestyle='--', alpha=0.7)

    # 调整布局
    plt.tight_layout()
    plt.subplots_adjust(hspace=0.4)

    # 显示图表
    plt.show()

if __name__ == "__main__":
    # 设置参数
    stock_code = "SH600938"  # 中国工商银行
    start_date = "2025-01-01"
    end_date = datetime.now().strftime("%Y-%m-%d")

    print(f"正在获取 {stock_code} 从 {start_date} 到 {end_date} 的数据...")

    # 获取数据
    stock_data = get_stock_data(stock_code, start_date, end_date)

    if stock_data is not None and not stock_data.empty:
        print(f"成功获取 {len(stock_data)} 条数据")

        # 计算指标
        print("正在计算技术指标...")
        stock_data_with_indicators = calculate_technical_indicators(stock_data)

        # 显示数据预览
        print("\n数据预览:")
        print(stock_data_with_indicators.tail())

        # 绘图
        print("\n正在绘制图表...")
        plot_stock_analysis(stock_data_with_indicators, stock_code)
    else:
        print("获取数据失败,请检查股票代码和网络连接")
股票数据分析程序总结
程序功能
本程序实现了股票数据的获取、技术指标计算和可视化分析功能,主要包括:
- 数据获取:使用akshare库获取指定股票的历史日线数据
- 指标计算:使用pandas计算多种常用技术指标
- 可视化分析:通过matplotlib绘制直观的分析图表
技术实现
1. 数据获取 (get_stock_data函数)
- 使用akshare库获取A股股票历史数据
- 支持自动转换股票代码格式(如’SH600938’转换为’sh600938’)
- 支持自动转换日期格式(如’2024-01-01’转换为’20240101’)
2. 指标计算 (calculate_technical_indicators函数)
- 均线指标:计算5日、10日、20日和60日均线
- RSI指标:计算14日相对强弱指标
- 成交量:直接从原始数据获取
- 股价变化标准差:计算20日窗口的收盘价标准差
- 日收益率:用于风险分析参考
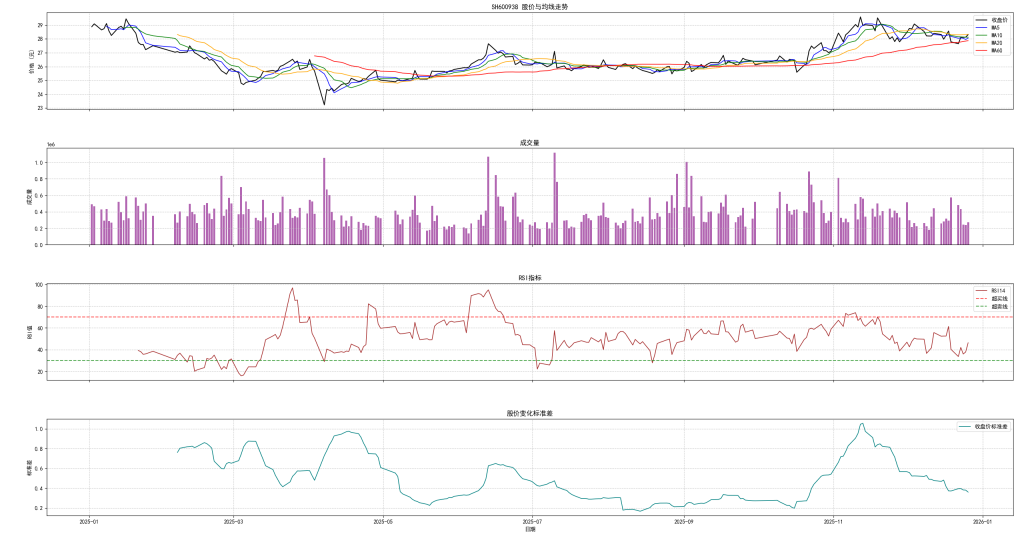
3. 可视化分析 (plot_stock_analysis函数)
- 绘制4个子图的综合分析图表:
- 股价与多周期均线对比图
- 成交量柱状图
- RSI指标图(含超买超卖线)
- 股价变化标准差图
- 支持中文显示,确保图表可读性
- 提供网格线、图例等辅助元素
使用方法
- 确保安装了必要的库:
pandas、numpy、matplotlib、akshare - 修改
stock_code、start_date参数可查看不同股票和时间段的数据 - 运行程序后会自动执行数据获取、指标计算和图表绘制
优势
- 无需注册账户即可使用(避免了tqcenter需要登录的问题)
- 代码简洁易懂,便于修改和扩展
- 支持多种常用技术指标,满足基本分析需求
- 图表直观清晰,便于理解股票走势和指标变化
该程序适合股票投资者和分析师进行基本的技术分析,也可作为学习金融数据处理和可视化的参考示例。