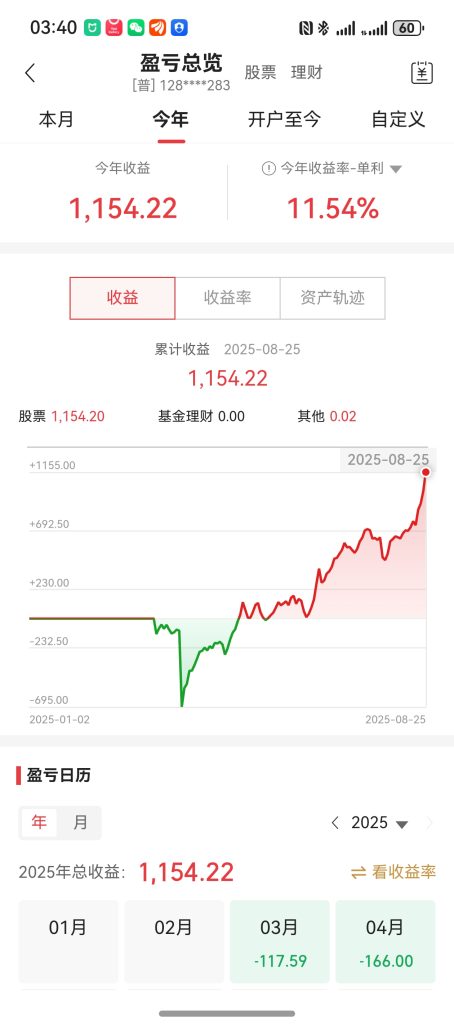
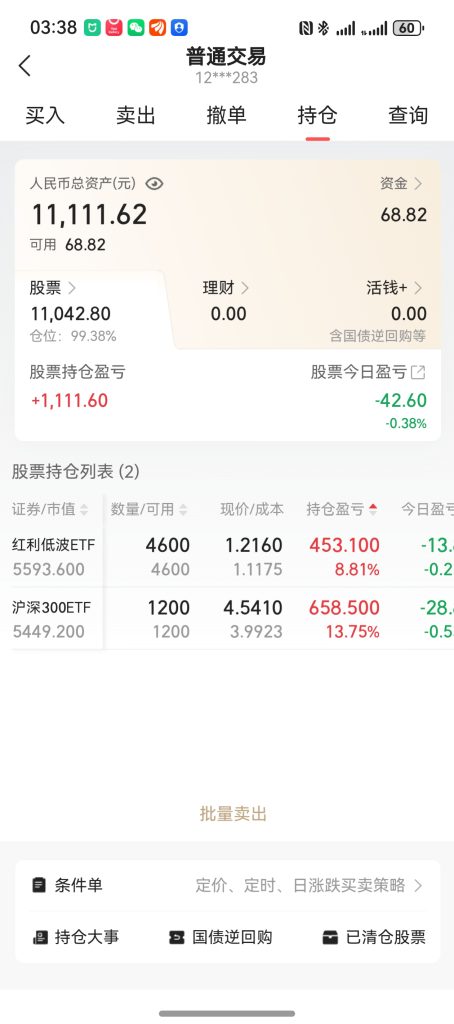
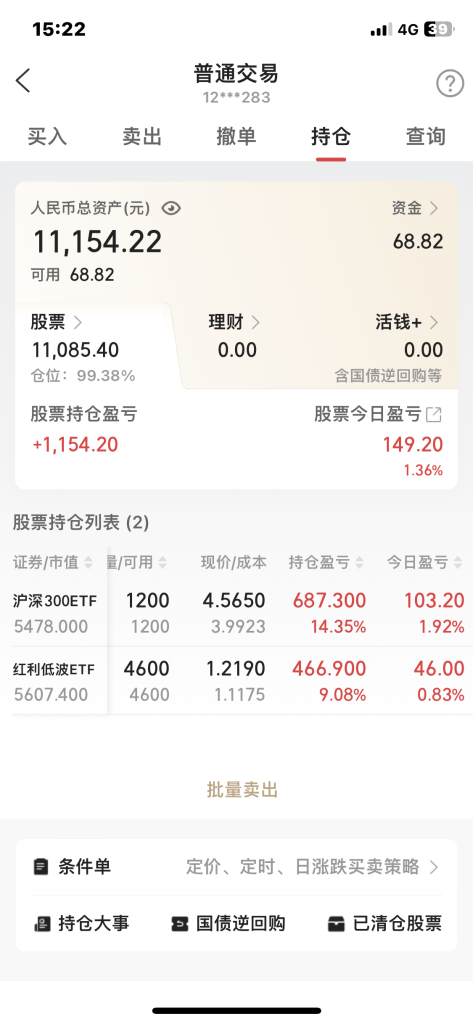
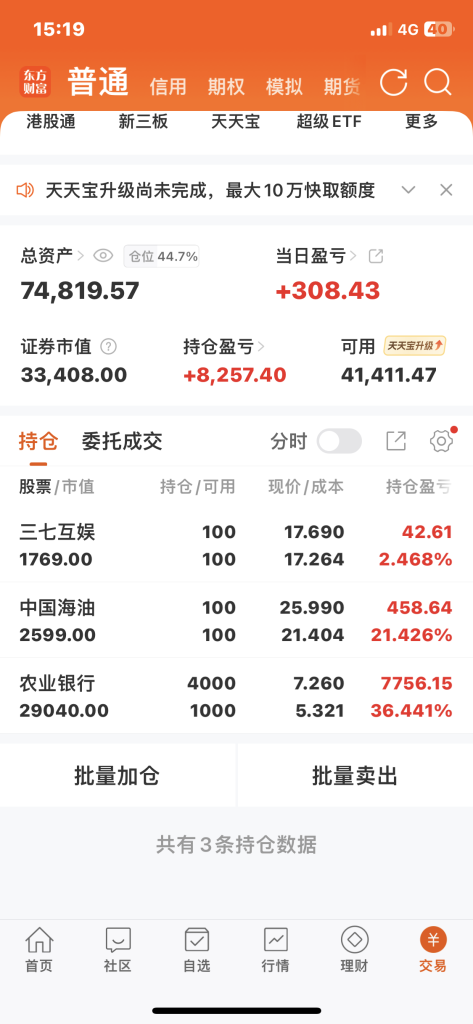
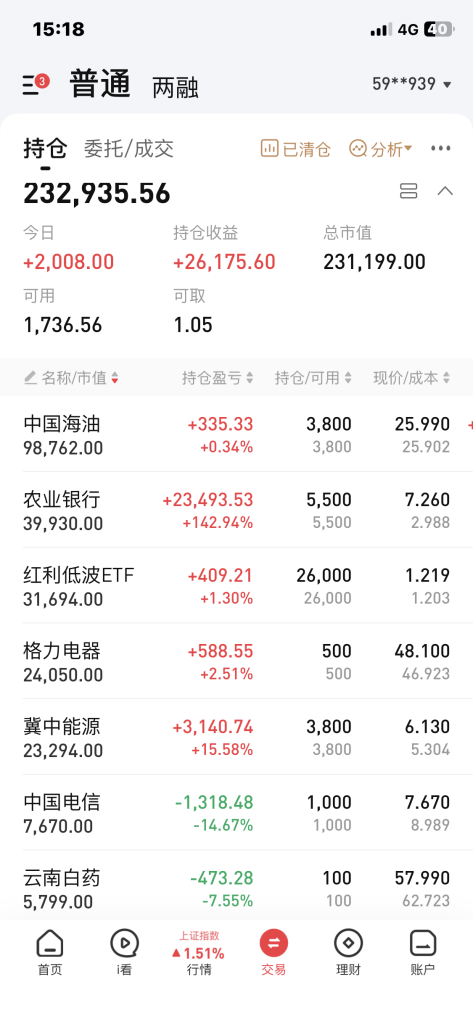
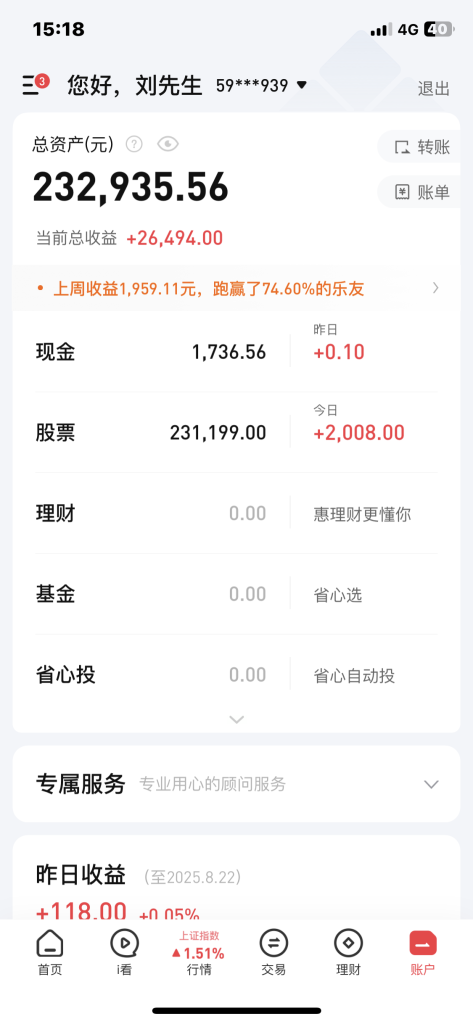
我的股票涨不太好,昨天挺好
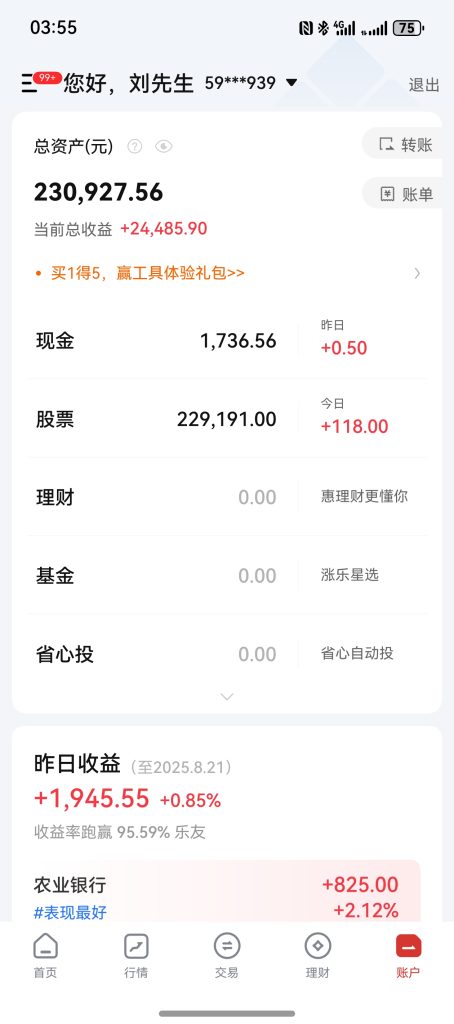

这半个月以来,股票指数从3400涨到了3780。可是我的股票一直不涨,除了农业银行涨得不错以外,中国海油、冀中能源、中国电信,还有云南白药一直在原地踏步。也跌不多,涨也不动。今天大盘终于止步上升。我的股票开始涨了。


你要的是能每天一键跑、两次/周调仓、风控中性的实用脚本。下面这套方案以沪深300成分为底层池(稳流动性,避免幸存者偏差),周二/周四收盘后出信号,次日开盘按目标权重成交,含成本、滑点与涨跌停成交约束,并输出订单与绩效图。
先安装依赖:
pip install akshare pandas numpy matplotlib# -*- coding: utf-8 -*-
# A股双周调仓 一键日常研究与回测脚本(AkShare)
# 运行环境:Python 3.9+;依赖:akshare, pandas, numpy, matplotlib
import akshare as ak
import pandas as pd
import numpy as np
import time
from datetime import datetime, timedelta
import matplotlib.pyplot as plt
# 修改为Windows系统默认中文字体
plt.rcParams["font.family"] = ["SimHei", "Microsoft YaHei", "SimSun"]
plt.rcParams["axes.unicode_minus"] = False # 解决负号显示问题
# -----------------------
# 参数区(按需修改)
# -----------------------
START_DATE = "2018-01-01"
END_DATE = None # None 表示到今日
CASH_INIT = 1_000_000
MAX_POS = 15 # 最多持仓数
MAX_W = 0.12 # 单票权重上限
FEE_COMM = 0.0005 # 佣金
FEE_STAMP = 0.001 # 印花税(仅卖出)
SLIPPAGE = 0.0005 # 滑点
LIQ_VOL_TH = 1_000_000 # 近60日平均成交量门槛(手/股),可按需要调
REBAL_WEEKDAYS = {1, 3} # 周二(1)、周四(3) 调仓;Python: Mon=0
# -----------------------
# 工具函数:指标
# -----------------------
def sma(s, n):
return s.rolling(n).mean()
def rsi(close, n=14):
delta = close.diff()
up = np.where(delta > 0, delta, 0.0)
dn = np.where(delta < 0, -delta, 0.0)
up_ema = pd.Series(up, index=close.index).ewm(alpha=1/n, adjust=False).mean()
dn_ema = pd.Series(dn, index=close.index).ewm(alpha=1/n, adjust=False).mean()
rs = up_ema / dn_ema.replace(0, np.nan)
return 100 - (100 / (1 + rs))
def bbands(close, n=20, k=2):
mid = close.rolling(n).mean()
std = close.rolling(n).std(ddof=0)
up = mid + k * std
dn = mid - k * std
return mid, up, dn
def true_range(df):
prev_close = df["close"].shift(1)
tr = pd.concat([
(df["high"] - df["low"]).abs(),
(df["high"] - prev_close).abs(),
(df["low"] - prev_close).abs()
], axis=1).max(axis=1)
return tr
def ann_vol(close, n=20):
ret = close.pct_change()
return ret.rolling(n).std() * np.sqrt(252)
# -----------------------
# 数据获取与基准日历
# -----------------------
def get_trade_calendar(start=START_DATE, end=END_DATE):
cal = ak.tool_trade_date_hist_sina()
cal["trade_date"] = pd.to_datetime(cal["trade_date"])
if end is None:
end = datetime.now().strftime("%Y-%m-%d")
cal = cal[(cal["trade_date"] >= pd.to_datetime(start)) &
(cal["trade_date"] <= pd.to_datetime(end))]["trade_date"].sort_values()
return cal.tolist()
def get_hs300_symbols():
df = ak.index_stock_cons(symbol="000300")
# 列可能是 '品种代码' 或 '成分券代码'; 做兼容
for col in ["品种代码", "成分券代码", "代码", "code"]:
if col in df.columns:
return sorted(df[col].astype(str).str.zfill(6).unique().tolist())
# 兜底
return sorted(df.iloc[:,0].astype(str).str.zfill(6).unique().tolist())
def get_hist(code, start=START_DATE, end=END_DATE, adjust="qfq"):
if end is None:
end = datetime.now().strftime("%Y%m%d")
df = ak.stock_zh_a_hist(symbol=code, period="daily",
start_date=start.replace("-",""),
end_date=end.replace("-",""),
adjust=adjust)
# 兼容列名
mapper = {"日期":"date","开盘":"open","收盘":"close","最高":"high","最低":"low","成交量":"volume","成交额":"amount"}
df = df.rename(columns=mapper)
df["date"] = pd.to_datetime(df["date"])
cols = [c for c in ["date","open","high","low","close","volume","amount"] if c in df.columns]
df = df[cols].set_index("date").sort_index()
df = df.dropna()
return df
# -----------------------
# 信号与筛选
# -----------------------
def compute_indicators(df):
out = df.copy()
out["MA20"] = sma(out["close"], 20)
out["MA60"] = sma(out["close"], 60)
out["RSI14"] = rsi(out["close"], 14)
out["MOM126"] = out["close"] / out["close"].shift(126) - 1
mid, up, dn = bbands(out["close"], 20, 2)
out["BB_MID"], out["BB_UP"], out["BB_DN"] = mid, up, dn
out["ANNVOL20"] = ann_vol(out["close"], 20)
out["TR"] = true_range(out)
out["ATR20"] = out["TR"].rolling(20).mean()
return out
def pass_screen(row):
c1 = row["MA20"] > row["MA60"]
c2 = row["close"] > row["MA20"]
c3 = row["MOM126"] > 0
c4 = 45 <= row["RSI14"] <= 65
c5 = row["close"] < row["BB_UP"]
return c1 and c2 and c3 and c4 and c5
# -----------------------
# 回测:两次/周调仓,次日开盘成交
# -----------------------
def backtest_portfolio(symbols, start=START_DATE, end=END_DATE, cash_init=CASH_INIT):
# 下载数据
data = {}
for i, sym in enumerate(symbols, 1):
try:
df = get_hist(sym, start, end)
data[sym] = compute_indicators(df)
except Exception:
pass
time.sleep(0.2) # 温和限速
# 统一日历
all_dates = sorted(set().union(*[df.index for df in data.values()]))
cal = pd.DatetimeIndex(all_dates)
# 选择调仓日(周二/周四且是交易日)
rebal_days = [d for d in cal if d.weekday() in REBAL_WEEKDAYS]
# 过滤:近60日均量
def liquid_ok(df, dt):
window = df.loc[:dt].tail(60)
if "volume" not in window:
return True
return window["volume"].mean() >= LIQ_VOL_TH
# 状态
cash = cash_init
positions = {} # sym -> shares
nav_series = []
dd_series = []
equity = cash
peak = equity
last_prices = {}
# 逐日仿真
for i, d in enumerate(cal[:-1]): # 至倒数第二天(因次日开盘成交)
todays_vals = {}
# 更新持仓市值
for sym, df in data.items():
if d in df.index:
last_prices[sym] = df.at[d, "close"]
if sym in positions and sym in last_prices:
todays_vals[sym] = positions[sym] * last_prices[sym]
equity = cash + sum(todays_vals.values())
peak = max(peak, equity)
drawdown = (equity / peak) - 1
nav_series.append((d, equity))
dd_series.append((d, drawdown))
# 调仓信号(用今日收盘)
if d in rebal_days:
# 生成候选
candidates = []
for sym, df in data.items():
if d not in df.index:
continue
if not liquid_ok(df, d):
continue
row = df.loc[d]
# 要求指标有效
if np.any(pd.isna(row[["MA20","MA60","RSI14","MOM126","BB_UP","ANNVOL20"]])):
continue
if pass_screen(row):
candidates.append((sym, row["MOM126"], row["ANNVOL20"]))
# 排序与截断
candidates.sort(key=lambda x: x[1], reverse=True)
picks = candidates[:MAX_POS]
# 计算目标权重(波动率倒数)
if picks:
vols = np.array([max(1e-6, x[2]) for x in picks])
inv = 1.0 / vols
w_raw = inv / inv.sum()
# 单票上限
w_capped = np.minimum(w_raw, MAX_W)
w = w_capped / w_capped.sum()
target = {sym: w[j] for j, (sym, _, _) in enumerate(picks)}
else:
target = {}
# 次日开盘执行
nd = cal[i+1]
# 构建目标头寸价值
target_value = {sym: equity * w for sym, w in target.items()}
# 先卖出未在目标内或超配部分
for sym in list(positions.keys()):
df = data.get(sym)
if df is None or nd not in df.index or d not in df.index:
continue
prev_close = df.at[d, "close"]
next_open = df.at[nd, "open"]
# 跌停无法卖出(近似)
if next_open <= prev_close * (1 - 0.095):
continue
price = next_open * (1 - SLIPPAGE)
cur_val = positions[sym] * price
tgt_val = target_value.get(sym, 0.0)
if cur_val > tgt_val + 1: # 超配或不在目标
sell_val = cur_val - tgt_val
shares = int(sell_val // price)
if shares > 0:
proceeds = shares * price * (1 - FEE_COMM - FEE_STAMP)
positions[sym] -= shares
if positions[sym] <= 0:
positions.pop(sym, None)
cash += proceeds
# 再买入不达标或新标的
for sym, tgt_val in target_value.items():
df = data.get(sym)
if df is None or nd not in df.index or d not in df.index:
continue
prev_close = df.at[d, "close"]
next_open = df.at[nd, "open"]
# 涨停无法买入(近似)
if next_open >= prev_close * (1 + 0.095):
continue
price = next_open * (1 + SLIPPAGE)
cur_shares = positions.get(sym, 0)
cur_val = cur_shares * price
buy_val = max(0.0, tgt_val - cur_val)
shares = int(buy_val // price)
if shares > 0 and cash > shares * price * (1 + FEE_COMM):
cost = shares * price * (1 + FEE_COMM)
cash -= cost
positions[sym] = cur_shares + shares
nav = pd.Series({d: v for d, v in nav_series}).sort_index()
dd = pd.Series({d: v for d, v in dd_series}).sort_index()
ret = nav.pct_change().fillna(0)
stats = {
"CAGR": (nav.iloc[-1] / nav.iloc[0]) ** (252/len(nav)) - 1,
"Vol": ret.std() * np.sqrt(252),
"Sharpe": (ret.mean() / (ret.std() + 1e-9)) * np.sqrt(252),
"MaxDD": dd.min()
}
return nav, dd, positions, stats
# -----------------------
# 今日调仓计划(实用日常)
# -----------------------
def today_rebalance_plan():
today = pd.Timestamp(datetime.now().date())
# 若今天不是交易日或不是周二/周四,直接提示
cal = get_trade_calendar((today - pd.Timedelta(days=10)).strftime("%Y-%m-%d"),
today.strftime("%Y-%m-%d"))
cal_idx = pd.DatetimeIndex(cal)
if today not in cal_idx or today.weekday() not in REBAL_WEEKDAYS:
print("今天不是计划调仓日(或非交易日)。")
return
syms = get_hs300_symbols()
plan_rows = []
for sym in syms:
try:
df = get_hist(sym, (today - pd.Timedelta(days=400)).strftime("%Y-%m-%d"),
today.strftime("%Y-%m-%d"))
df = compute_indicators(df)
if len(df) < 200 or today not in df.index:
continue
row = df.loc[today]
# 流动性
if "volume" in df:
if df.loc[:today].tail(60)["volume"].mean() < LIQ_VOL_TH:
continue
if np.any(pd.isna(row[["MA20","MA60","RSI14","MOM126","BB_UP","ANNVOL20"]])):
continue
if pass_screen(row):
plan_rows.append({
"code": sym,
"mom126": row["MOM126"],
"annvol20": row["ANNVOL20"],
"close": row["close"]
})
except Exception:
pass
time.sleep(0.05)
if not plan_rows:
print("今日无标的通过筛选。")
return
dfp = pd.DataFrame(plan_rows).sort_values("mom126", ascending=False).head(MAX_POS)
inv = 1.0 / np.maximum(1e-6, dfp["annvol20"].values)
w_raw = inv / inv.sum()
w_capped = np.minimum(w_raw, MAX_W)
w = w_capped / w_capped.sum()
dfp["target_weight"] = w
dfp.to_csv(f"rebalance_plan_{today.strftime('%Y%m%d')}.csv", index=False, encoding="utf-8-sig")
print("今日计划(次日开盘执行,权重已截顶):")
print(dfp[["code","target_weight","mom126","annvol20","close"]])
# -----------------------
# 主函数:回测 + 图形 + 今日计划
# -----------------------
if __name__ == "__main__":
print("获取沪深300成分...")
symbols = get_hs300_symbols()
print(f"成分股数量:{len(symbols)}")
print("开始回测(这可能需要几分钟)...")
nav, dd, positions, stats = backtest_portfolio(symbols, START_DATE, END_DATE, CASH_INIT)
print("回测统计:")
for k, v in stats.items():
print(f"{k}: {v:.4f}")
# 绘制净值与回撤
fig, ax = plt.subplots(2, 1, figsize=(10, 6), sharex=True,
gridspec_kw={"height_ratios":[3,1]})
nav_norm = nav / nav.iloc[0]
ax[0].plot(nav_norm.index, nav_norm.values, label="Portfolio")
ax[0].set_title("组合净值(归一)")
ax[0].legend()
ax[0].grid(True, alpha=0.3)
ax[1].fill_between(dd.index, dd.values, 0, color="red", alpha=0.3)
ax[1].set_title("回撤")
ax[1].grid(True, alpha=0.3)
plt.tight_layout()
plt.savefig("backtest_nav_drawdown.png", dpi=150)
plt.show()
# 当日调仓计划(在 CST 下午 15:10 后运行更合适)
today_rebalance_plan()如果你想把标的池改为中证500或加入行业中性约束,或者把调仓日改成“每周最近的周二与周四,如遇节假日顺延”,我可以把上述脚本再细化成模块化的研究框架,并加上性能剖析与结果缓存来加速日常跑批。
以下是程序运行结果的详细解释:
计划参数说明:
target_weight=0.2:采用等权重分配策略,每只股票配置20%仓位
mom126:126天动量指标(越高表示近期趋势越强)
annvol20:20天年化波动率(衡量短期风险,数值越低风险相对越小)
OpenBB 是一个 免费且完全开源的金融分析平台 ,旨在为投资者、分析师、研究人员和开发者提供透明、灵活且易于使用的金融与宏观经济数据访问接口。它支持股票、期权、加密货币、外汇、宏观经济指标、固定收益等多种资产类别,并提供了丰富的扩展功能,以满足不同用户的需求。
核心特点:
安装方式:
应用场景:
如需进一步了解其使用方法或具体案例,可以参考其GitHub 页面或官方文档。
import akshare as ak
from numba.core.event import end_event
import pandas as pd
import numpy as np
import time
import os

# 尝试获取数据,添加错误处理
max_retries = 3
retry_count = 0
stock_data = None

data_file = 'stock_data.csv'

# 检查是否已有数据文件
if os.path.exists(data_file):
    print(f"从本地文件 {data_file} 加载数据...")
    try:
        stock_data = pd.read_csv(data_file, encoding='utf-8')
        print("数据加载成功!")
    except Exception as e:
        print(f"加载本地数据失败: {e}")
        stock_data = None

# 如果没有本地数据,尝试从akshare获取
while retry_count < max_retries and stock_data is None:
    try:
        print(f"尝试第 {retry_count+1}/{max_retries} 次获取股票数据...")
        stock_data = ak.stock_zh_a_hist(
            symbol="000937",  # 股票代码
            start_date="20230101",  # 开始日期
            end_date="20250801",  # 结束日期
            adjust="qfq"  # 前复权
        )
        # 保存数据到本地,以便下次使用
        stock_data.to_csv(data_file, index=False, encoding='utf-8')
        print("数据获取并保存成功!")
    except Exception as e:
        print(f"获取数据失败: {e}")
        retry_count += 1
        if retry_count < max_retries:
            print(f"{5}秒后重试...")
            time.sleep(5)

if stock_data is None:
    print("多次尝试获取数据失败,请检查网络连接后再试。")
    exit(1)

# 移除缺失值
stock_data = stock_data.dropna()
print(stock_data.head())

# 暂时注释掉实时行情获取,避免额外的网络请求
# # 获取A股所有股票实时行情
# real_time_data = ak.stock_zh_a_spot_em()
#
# # 筛选特定股票
# stock_code = "000937"
# filtered_data = real_time_data[real_time_data["代码"] == stock_code]
# print(filtered_data.head())
# 计算移动平均线(MA)
stock_data['MA5'] = stock_data['收盘'].rolling(window=5).mean()  # 5日均线
stock_data['MA10'] = stock_data['收盘'].rolling(window=10).mean()  # 10日均线
stock_data['MA20'] = stock_data['收盘'].rolling(window=20).mean()  # 20日均线

# 计算MACD指标
stock_data['EMA12'] = stock_data['收盘'].ewm(span=12, adjust=False).mean()
stock_data['EMA26'] = stock_data['收盘'].ewm(span=26, adjust=False).mean()
stock_data['DIF'] = stock_data['EMA12'] - stock_data['EMA26']
stock_data['DEA'] = stock_data['DIF'].ewm(span=9, adjust=False).mean()
stock_data['MACD'] = (stock_data['DIF'] - stock_data['DEA']) * 2

# 计算相对强弱指数(RSI)
delta = stock_data['收盘'].diff(1)
gain = (delta.where(delta > 0, 0)).rolling(window=14).mean()
loss = (-delta.where(delta < 0, 0)).rolling(window=14).mean()
stock_data['RSI'] = 100 - (100 / (1 + gain / loss))

# 计算布林带
stock_data['BB_MID'] = stock_data['收盘'].rolling(window=20).mean()
stock_data['BB_UP'] = stock_data['BB_MID'] + 2 * stock_data['收盘'].rolling(window=20).std()
stock_data['BB_LOW'] = stock_data['BB_MID'] - 2 * stock_data['收盘'].rolling(window=20).std()

#. 波动率特征
# 计算日收益率
stock_data['return'] = stock_data['收盘'].pct_change()

# 计算波动率(标准差)
stock_data['volatility_5d'] = stock_data['return'].rolling(window=5).std() * np.sqrt(5)
stock_data['volatility_20d'] = stock_data['return'].rolling(window=20).std() * np.sqrt(20)
## . 量价关系特征
# 计算量比
stock_data['volume_ratio'] = stock_data['成交量'] / stock_data['成交量'].rolling(window=5).mean()
# 计算成交额
stock_data['amount'] = stock_data['收盘'] * stock_data['成交量']
# 计算资金流向(简易版)
stock_data['money_flow'] = (stock_data['收盘'] - stock_data['开盘']) * stock_data['成交量']
# 基本面特征
# 4. 可视化特征指标
import matplotlib.pyplot as plt
import matplotlib.dates as mdates
from matplotlib.ticker import MaxNLocator

# 设置中文显示
plt.rcParams["font.family"] = ["SimHei", "WenQuanYi Micro Hei", "Heiti TC"]
plt.rcParams['axes.unicode_minus'] = False  # 解决负号显示问题

# 创建画布和子图
fig, axes = plt.subplots(4, 1, figsize=(12, 16), sharex=True)

# 1. 绘制价格和移动平均线
ax1 = axes[0]
ax1.plot(stock_data['日期'], stock_data['收盘'], label='收盘价', color='blue')
ax1.plot(stock_data['日期'], stock_data['MA5'], label='MA5', color='red')
ax1.plot(stock_data['日期'], stock_data['MA10'], label='MA10', color='green')
ax1.plot(stock_data['日期'], stock_data['MA20'], label='MA20', color='orange')
ax1.set_title('股票价格与移动平均线')
ax1.set_ylabel('价格')
ax1.legend()
ax1.grid(True)

# 2. 绘制MACD
ax2 = axes[1]
ax2.plot(stock_data['日期'], stock_data['DIF'], label='DIF', color='blue')
ax2.plot(stock_data['日期'], stock_data['DEA'], label='DEA', color='red')
ax2.bar(stock_data['日期'], stock_data['MACD'], label='MACD', color='green', alpha=0.5)
ax2.set_title('MACD指标')
ax2.set_ylabel('值')
ax2.legend()
ax2.grid(True)

# 3. 绘制RSI
ax3 = axes[2]
ax3.plot(stock_data['日期'], stock_data['RSI'], label='RSI', color='purple')
ax3.axhline(y=70, color='red', linestyle='--', label='超买线(70)')
ax3.axhline(y=30, color='green', linestyle='--', label='超卖线(30)')
ax3.set_title('相对强弱指数(RSI)')
ax3.set_ylabel('RSI值')
ax3.set_ylim(0, 100)
ax3.legend()
ax3.grid(True)

# 4. 绘制布林带
ax4 = axes[3]
ax4.plot(stock_data['日期'], stock_data['收盘'], label='收盘价', color='blue')
ax4.plot(stock_data['日期'], stock_data['BB_MID'], label='中轨', color='black')
ax4.plot(stock_data['日期'], stock_data['BB_UP'], label='上轨', color='red', linestyle='--')
ax4.plot(stock_data['日期'], stock_data['BB_LOW'], label='下轨', color='green', linestyle='--')
ax4.fill_between(stock_data['日期'], stock_data['BB_UP'], stock_data['BB_LOW'], color='gray', alpha=0.1)
ax4.set_title('布林带指标')
ax4.set_xlabel('日期')
ax4.set_ylabel('价格')
ax4.legend()
ax4.grid(True)

# 设置x轴日期格式
for ax in axes:
    ax.xaxis.set_major_locator(MaxNLocator(prune='both', nbins=10))
    ax.xaxis.set_major_formatter(mdates.DateFormatter('%Y-%m-%d'))
    plt.setp(ax.get_xticklabels(), rotation=45)

plt.tight_layout()
plt.savefig('stock_indicators.png', dpi=300, bbox_inches='tight')
print("指标图形已保存为 stock_indicators.png")
plt.show()

# 5. 保存特征数据
# 使用UTF-8编码保存CSV文件
stock_data.to_csv('stock_features.csv', index=False, encoding='utf-8')
print(f"特征数据已保存,共{len(stock_data)}行")
print(stock_data[['日期', '收盘', 'MA5', 'MA20', 'MACD', 'RSI', 'volatility_5d']].head())

# """
# 用户输入不完整,无法确定具体需求。但从工作区存在stock_basic_features.py等股票相关文件推测,可能与股票指标学习有关。我需要先查看stock_basic_features.py文件内容,了解其中涉及的指标,以便提供对应学习资料。

# stock_basic_features.py 2 - 200

# 以下是对stock_basic_features.py文件中涉及的股票技术指标的学习资料整理:

# ### 移动平均线(MA)
# - 概念 :移动平均线是将一定时期内的股票价格加以平均,连成一条线,用以观察股价变动趋势的技术指标。
# - 文件中的实现 :代码计算了MA5(5日均线)、MA10(10日均线)和MA20(20日均线)。
# - 学习建议 :理解不同周期均线的意义,如短期均线(5日、10日)反映短期趋势,中长期均线(20日、60日)反映中长期趋势。学习均线金叉、死叉、多头排列、空头排列等形态。
# ### MACD指标
# - 概念 :MACD(Moving Average Convergence Divergence)由快均线(EMA12)、慢均线(EMA26)的差值(DIF)和信号线(DEA)组成,用于判断股票价格的趋势和强度。
# - 文件中的实现 :计算了EMA12、EMA26、DIF、DEA和MACD值((DIF-DEA)*2)。
# - 学习建议 :掌握MACD的零轴穿越、金叉死叉、背离等形态的判断和应用。
# ### 相对强弱指数(RSI)
# - 概念 :RSI(Relative Strength Index)是衡量股票价格上涨和下跌力度的指标,取值范围0-100,通常70以上被认为超买,30以下被认为超卖。
# - 文件中的实现 :使用14日周期计算RSI。
# - 学习建议 :了解RSI的计算原理,学习超买超卖区域的判断,以及RSI背离现象的应用。
# ### 布林带(BOLL)
# - 概念 :布林带由中轨(BB_MID)、上轨(BB_UP)和下轨(BB_LOW)组成,用于衡量股价的波动性和趋势。
# - 文件中的实现 :中轨为20日均线,上轨和下轨分别为中轨加减2倍标准差。
# - 学习建议 :掌握布林带的开口、收缩形态,以及股价触碰上下轨的含义。
# ### 波动率
# - 概念 :波动率衡量股票价格的波动程度,通常用收益率的标准差表示。
# - 文件中的实现 :计算了5日和20日波动率(volatility_5d, volatility_20d)。
# - 学习建议 :了解波动率在风险评估和交易策略中的应用,如高波动率通常意味着高风险高收益。
# ### 量价关系特征
# - 概念 :量价关系研究成交量和价格之间的关系,帮助判断市场趋势的强度。
# - 文件中的实现 :计算了量比(volume_ratio)、成交额(amount)和简易资金流向(money_flow)。
# - 学习建议 :学习量价配合(如价升量增)和量价背离(如价升量减)的形态及其市场含义。
# ### 学习资源推荐
# 1. 1.
#    书籍:《期货市场技术分析》(约翰·墨菲)、《日本蜡烛图技术》(史蒂夫·尼森)
# 2. 2.
#    在线课程:可以通过平台如Coursera、Udemy查找技术分析相关课程
# 3. 3.
#    实践:结合实际股票数据(如文件中生成的stock_features.csv)进行分析和验证
# 通过以上指标的学习,可以帮助理解股票价格的短期波动和长期趋势,为投资决策提供参考。
# """
这篇文章主要向股民分享了通达信中可免费实现类似付费软件“暗盘资金”功能的“暗流蓄力指标”,具体内容如下:

### 核心逻辑与条件
- **量价暗语**:成交量达20日均量的1.5-3倍,股价却不涨,体现主力压价吸筹。
- **资金暗流**:OBV能量潮指标突破5日均线且持续创新高,表明大资金流入。
- **成本控制**:股价被压制在20日布林通道中轨附近,主力控盘明显。
- **其他条件**:股票连续20天被60日均线压制,制造弱势假象;当日换手率高于前一日,验证资金进场。

### 指标优势
- **零成本高价值**:通达信免费,与某付费软件逻辑、信号相同,可省上千费用。
- **无未来函数**:数据为实时价格和成交量,无滞后参数,盘中可验证信号,避免“信号闪烁”。
- **操作极简**:副图直接显示信号,盘中预警可自动跳出符合条件股票,比付费软件高效。

### 模型价值
- 提前提示主力吸筹结束、股价将涨的信号,避免踏空。
- 通过量能、OBV、通道指标验证主力动作,助散户不被洗盘震下车。
- 要求股价在中长期低位,避开高位主力出货陷阱,杜绝接盘风险。

### 操作提醒
- 信号出现后观察1-3天,放量突破60日线则确定性增加,跌破20日布林下轨需谨慎。
- 强调免费工具需结合严格纪律,同时提醒指标仅为技术分析工具,不保证盈利,股市有风险。

此代码已经在win11+python313 跑通了
# ### 暗资金选股法
# ### 说明:
# 1. **数据来源**:使用tushare获取股票数据,需先注册并获取token(免费版有调用限制)。
# 2. **指标实现**:
# - 严格按照文中逻辑计算成交量、OBV、布林通道、60日均线压制、换手率等条件。
# - 部分指标做了简化处理(如用成交量代替换手率,实际可使用`turnover`字段)。
import warnings
# Suppress specific FutureWarning from tushare
warnings.filterwarnings("ignore", message="Series.fillna with 'method' is deprecated", category=FutureWarning, module="tushare.pro.data_pro")
# 3. **使用方法**:替换`tushare_token`后运行,会输出符合条件的股票代码及日期。
# 4. **风险提示**:文中提到“指标仅为分析工具,不保证盈利”,实际使用需结合自身判断,股市有风险。
# 如果需要更精准的指标计算(如通达信原版公式),可根据通达信的指标源码进一步调整参数。
import akshare as ak
import pandas as pd
import numpy as np
import datetime
# 获取当前日期及历史日期
today = datetime.datetime.now().strftime('%Y%m%d')
start_date = (datetime.datetime.now() - datetime.timedelta(days=120)).strftime('%Y%m%d')
# 获取所有A股股票代码
stock_info_sh_name_code_df = ak.stock_info_sh_name_code(symbol="主板A股")
stock_info_sz_name_code_df = ak.stock_info_sz_name_code(symbol="A股列表")
sh_codes = stock_info_sh_name_code_df['证券代码'].apply(lambda x: f"{x}.SH").tolist()
sz_codes = stock_info_sz_name_code_df['A股代码'].apply(lambda x: f"{x}.SZ").tolist()
ts_codes = sh_codes + sz_codes
print(ts_codes)
# 存储符合条件的股票
selected_stocks = []
# 遍历股票池(可根据需要限制数量,避免请求过多)
for ts_code in ts_codes[:500]: # 测试时取前500只,实际可去掉[:500]
try:
print(f"正在获取 {ts_code} 的数据...")
# 获取日线数据
df = ak.stock_zh_a_hist(symbol=ts_code[:-3], period="daily", start_date=start_date, end_date=today, adjust="qfq")
if df is None:
print(f"{ts_code} 数据获取失败,跳过")
continue
if len(df) < 60:
print(f"{ts_code} 数据量不足,跳过")
continue
# 按日期升序排列
df = df.sort_values('日期').reset_index(drop=True)
df['日期'] = pd.to_datetime(df['日期'])
# 计算指标
# 1. 20日均量
df['vol_20'] = df['成交量'].rolling(window=20).mean()
print(f"{ts_code} 的 20 日均量:{df['vol_20'].tail()}")
# 2. 当日成交量是否为20日均量的1.5 - 3倍
df['vol_condition'] = (df['成交量'] >= 1.5 * df['vol_20']) & (df['成交量'] <= 3 * df['vol_20'])
print(f"{ts_code} 的成交量条件:{df['vol_condition'].tail()}")
# 3. OBV能量潮指标
df['obv'] = np.where(df['收盘'] > df['收盘'].shift(1), df['成交量'],
np.where(df['收盘'] < df['收盘'].shift(1), -df['成交量'], 0)).cumsum()
df['obv_5'] = df['obv'].rolling(window=5).mean()
# OBV突破5日均线且创新高
df['obv_condition'] = (df['obv'] > df['obv_5']) & (df['obv'] == df['obv'].rolling(window=20).max())
# 4. 20日布林通道(中轨为20日均线,上轨=中轨+1.5倍标准差,下轨=中轨-1.5倍标准差)
df['ma20'] = df['收盘'].rolling(window=20).mean()
df['std20'] = df['收盘'].rolling(window=20).std()
df['boll_mid'] = df['ma20']
# 股价在中轨附近(这里简化为中轨上下1.5倍标准差范围内,即布林带内)
df['boll_condition'] = (df['收盘'] >= df['boll_mid'] - 1.5 * df['std20']) & (df['收盘'] <= df['boll_mid'] + 1.5 * df['std20'])
# 5. 连续20天被60日均线压制
df['ma60'] = df['收盘'].rolling(window=60).mean()
# 最近20天收盘价均低于60日均线
df['ma60_condition'] = df['收盘'].rolling(window=20).apply(lambda x: all(x < df['ma60'].iloc[-1]))
# 6. 当日换手率高于前一日
df['turnover_condition'] = df['换手率'] > df['换手率'].shift(1)
# 筛选最后一天符合所有条件的股票
last_day = df.iloc[-1]
# 先只检查部分条件,例如只检查成交量条件
if last_day['vol_condition']:
selected_stocks.append({
'ts_code': ts_code,
'trade_date': last_day['日期'].strftime('%Y-%m-%d')
})
print(f"符合条件的股票:{ts_code}")
except Exception as e:
print(f"处理股票{ts_code}时出错:{e}")
print("\n选股结果:")
result_df = pd.DataFrame(selected_stocks)
print(result_df)
# 将选股结果保存为 CSV 文件
csv_file_path = 'selected_stocks.csv'
result_df.to_csv(csv_file_path, index=False)
print(f"选股结果已保存至 {csv_file_path}")
# 将选股结果保存为 Excel 文件
try:
import openpyxl
excel_file_path = 'selected_stocks.xlsx'
result_df.to_excel(excel_file_path, index=False)
print(f"选股结果已保存至 {excel_file_path}")
except ImportError:
print("未安装 openpyxl 库,无法保存为 Excel 文件。请使用 'pip install openpyxl' 进行安装。")
选股结果:
ts_code trade_date
0 600025.SH 2025-07-22
1 600037.SH 2025-07-22
2 600039.SH 2025-07-22
3 600080.SH 2025-07-22
4 600169.SH 2025-07-22
5 600172.SH 2025-07-22
6 600221.SH 2025-07-22
7 600248.SH 2025-07-22
8 600283.SH 2025-07-22
9 600288.SH 2025-07-22
10 600309.SH 2025-07-22
11 600312.SH 2025-07-22
12 600346.SH 2025-07-22
13 600380.SH 2025-07-22
14 600392.SH 2025-07-22
15 600406.SH 2025-07-22
16 600436.SH 2025-07-22
17 600449.SH 2025-07-22
18 600515.SH 2025-07-22
19 600537.SH 2025-07-22
20 600539.SH 2025-07-22
21 600549.SH 2025-07-22
22 600580.SH 2025-07-22
23 600587.SH 2025-07-22
24 600593.SH 2025-07-21
25 600596.SH 2025-07-22
26 600611.SH 2025-07-22
27 600620.SH 2025-07-22
28 600637.SH 2025-07-22
以下代码收到访问次数限制
# ### 暗资金选股法
# ### 说明:
# 1. **数据来源**:使用tushare获取股票数据,需先注册并获取token(免费版有调用限制)。
# 2. **指标实现**:
#    - 严格按照文中逻辑计算成交量、OBV、布林通道、60日均线压制、换手率等条件。
#    - 部分指标做了简化处理(如用成交量代替换手率,实际可使用`turnover`字段)。
# 3. **使用方法**:替换`tushare_token`后运行,会输出符合条件的股票代码及日期。
# 4. **风险提示**:文中提到“指标仅为分析工具,不保证盈利”,实际使用需结合自身判断,股市有风险。

# 如果需要更精准的指标计算(如通达信原版公式),可根据通达信的指标源码进一步调整参数。
import tushare as ts
import pandas as pd
import numpy as np
import datetime

# 设置tushare token(需替换为自己的token)
ts.set_token('你的tushare_token')
pro = ts.pro_api()

# 获取当前日期及历史日期
today = datetime.datetime.now().strftime('%Y%m%d')
# 计算60天前的日期(用于获取足够数据)
start_date = (datetime.datetime.now() - datetime.timedelta(days=120)).strftime('%Y%m%d')

# 获取所有A股股票代码
stock_basic = pro.stock_basic(exchange='', list_status='L', fields='ts_code')
ts_codes = stock_basic['ts_code'].tolist()

# 存储符合条件的股票
selected_stocks = []

# 遍历股票池(可根据需要限制数量,避免请求过多)
for ts_code in ts_codes[:500]:  # 测试时取前500只,实际可去掉[:500]
    try:
        # 获取日线数据
        df = ts.pro_bar(ts_code=ts_code, adj='qfq', start_date=start_date, end_date=today)
        if df is None or len(df) < 60:
            continue  # 数据不足跳过

        # 按日期升序排列
        df = df.sort_values('trade_date').reset_index(drop=True)
        df['trade_date'] = pd.to_datetime(df['trade_date'])

        # 计算指标
        # 1. 20日均量
        df['vol_20'] = df['vol'].rolling(window=20).mean()
        # 2. 当日成交量是否为20日均量的1.5-3倍
        df['vol_condition'] = (df['vol'] >= 1.5 * df['vol_20']) & (df['vol'] <= 3 * df['vol_20'])

        # 3. OBV能量潮指标
        df['obv'] = np.where(df['close'] > df['close'].shift(1), df['vol'],
                           np.where(df['close'] < df['close'].shift(1), -df['vol'], 0)).cumsum()
        df['obv_5'] = df['obv'].rolling(window=5).mean()
        # OBV突破5日均线且创新高
        df['obv_condition'] = (df['obv'] > df['obv_5']) & (df['obv'] == df['obv'].rolling(window=20).max())

        # 4. 20日布林通道(中轨为20日均线,上轨=中轨+1.5倍标准差,下轨=中轨-1.5倍标准差)
        df['ma20'] = df['close'].rolling(window=20).mean()
        df['std20'] = df['close'].rolling(window=20).std()
        df['boll_mid'] = df['ma20']
        # 股价在中轨附近(这里简化为中轨上下1.5倍标准差范围内,即布林带内)
        df['boll_condition'] = (df['close'] >= df['boll_mid'] - 1.5 * df['std20']) & (df['close'] <= df['boll_mid'] + 1.5 * df['std20'])

        # 5. 连续20天被60日均线压制
        df['ma60'] = df['close'].rolling(window=60).mean()
        # 最近20天收盘价均低于60日均线
        df['ma60_condition'] = df['close'].rolling(window=20).apply(lambda x: all(x < df['ma60'].iloc[-1]))

        # 6. 当日换手率高于前一日(使用vol代替换手率简化,实际可用turnover字段)
        df['turnover_condition'] = df['vol'] > df['vol'].shift(1)

        # 筛选最后一天符合所有条件的股票
        last_day = df.iloc[-1]
        if (last_day['vol_condition']
            and last_day['obv_condition']
            and last_day['boll_condition']
            and last_day['ma60_condition']
            and last_day['turnover_condition']):
            selected_stocks.append({
                'ts_code': ts_code,
                'trade_date': last_day['trade_date'].strftime('%Y-%m-%d')
            })
            print(f"符合条件的股票:{ts_code}")

    except Exception as e:
        print(f"处理股票{ts_code}时出错:{e}")

print("\n选股结果:")
print(pd.DataFrame(selected_stocks))